Graphical Representation of Motion

Graphs provide a convenient method to present basic information about a variety of events. For example, in the telecast of a one-day cricket match, vertical bar graphs show the run rate of a team in each over. To describe the motion of an object, we can use line graphs. In this case, line graphs show dependence of one physical quantity, such as distance or velocity, on another quantity, such as time.
Distance-Time Graphs
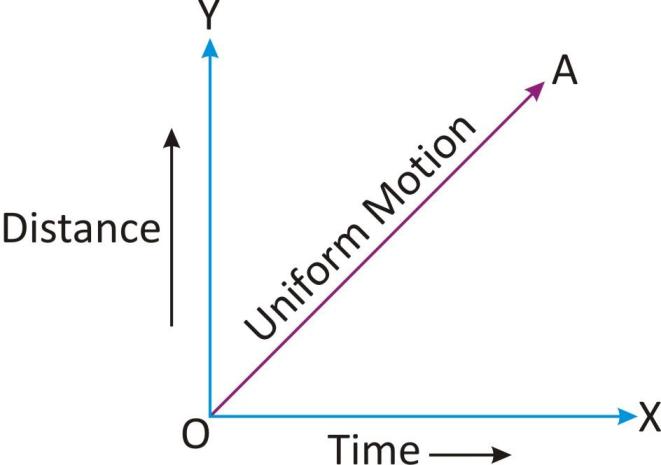
When a body moves with uniform speed, it will travel equal distances with in equal intervals of time. Thus, for uniform speed, a graph of distance travelled against time will be straight line as shown by line OA in fig 1. So, we can write the term ” uniform velocity” in place of “uniform speed” in the graph. So, the distance-time graph of a body moving at uniform speed is always a straight line.

The slope of a distance-time graph indicates speed of the body. So, the distance time graph of a body can be used to calculate the speed of the body.
Speed = Distance travelled/ time taken
Speed = OY/OX
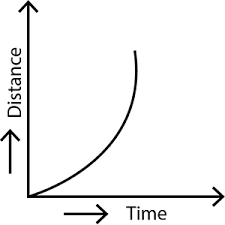
If, however, the speed of a body is non-uniform, then the graph between distance travelled and time is a curved line ( called a parabola).

When a body moves with a non-uniform speed, then its motion is said to be accelerated. So, the curved line also represents the distance- time graph of a body moving with accelerated motion.
Velocity-time graph
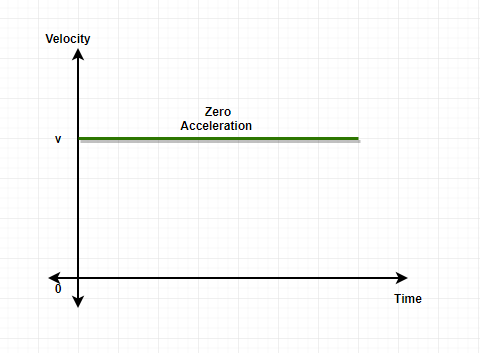
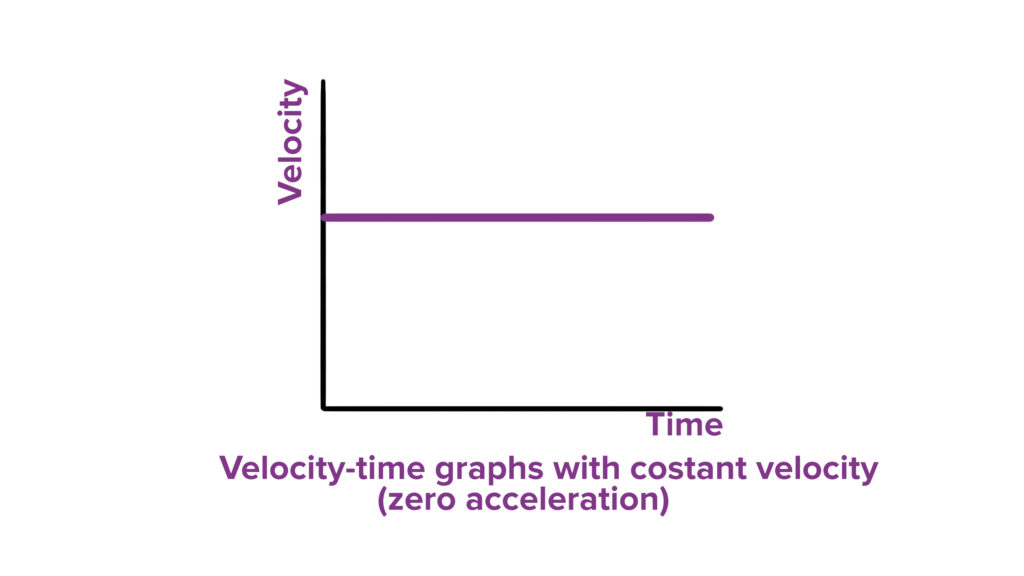
The variation in velocity with time for an object moving in a straight line can be represented by a velocity-time graph. In this graph, this is represented along the x-axis and the velocity is represented along the y-axis. If the object moves at uniform velocity, the height of its velocity-time graph will not change with time. It will be a straight line parallel to the x-axis.

We know that the product of velocity and time give displacement of an object moving with uniform velocity. The area enclosed by velocity-time graph and the time axis will be equal to the magnitude of the displacement.
When a body moves with uniform acceleration, its speed changes by equal amounts in equal intervals of time. Thus, the speed-time graph for a uniformly changing speed (or uniform acceleration) will be a straight line.


